10 Meter Clutter Data
What is it and why does it matter?
Regulatory Solutions Inc.
What is clutter data?
- A mapping layer of “land use/land cover” data over top of terrain data that shows what is really out there. Commonly referred to as tree data, it is more than just trees.
- Shows a clutter category per pixel, to which you define an elevation thereby creating 3 dimensions.
- Depending on the resoltuion of the data, only one clutter classification is shown at one time
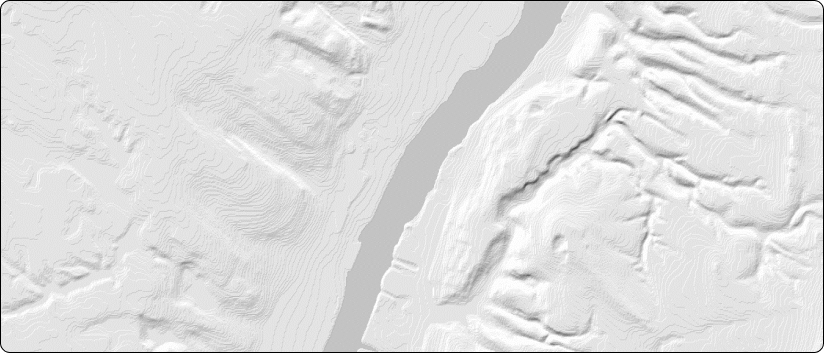
Basic terrain view for Albany NY
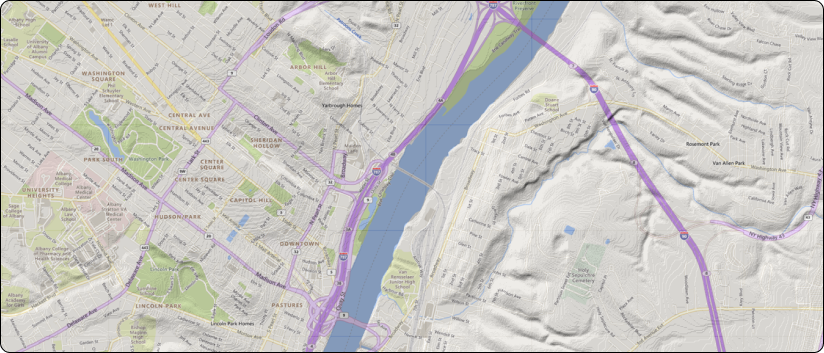
The same area with a map overlay
Clutter data is expressed in resolution
- The resolution of clutter is based on the size of the pixel or “bin” of the data used for the overlay on terrain.
- The most commonly used data is typically 30 meters, meaning the pixel/bin for that clutter is a square measured 30 meter on a side which can be overlaid on a map.
- That bin gets classified with the category that takes up the majority of space within the bin even there is more that one category within (buildings, trees, cropland, etc.). An example might be a house within a grove of thick trees that would only get classified as trees even though there is a building there.
That same Albany map with 30 meter clutter data overlaid.
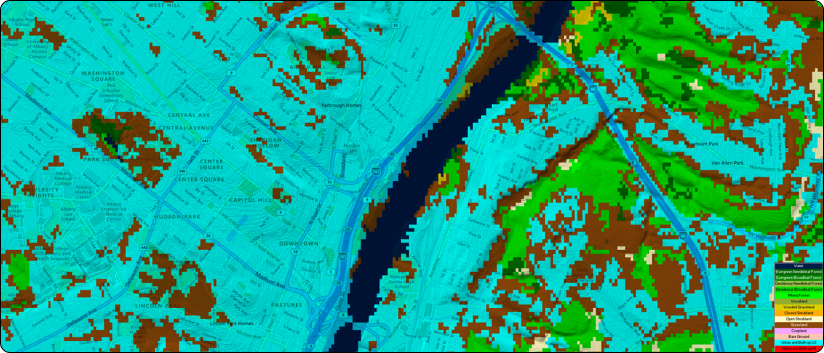
That same Albany map with 30 meter clutter data overlaid.
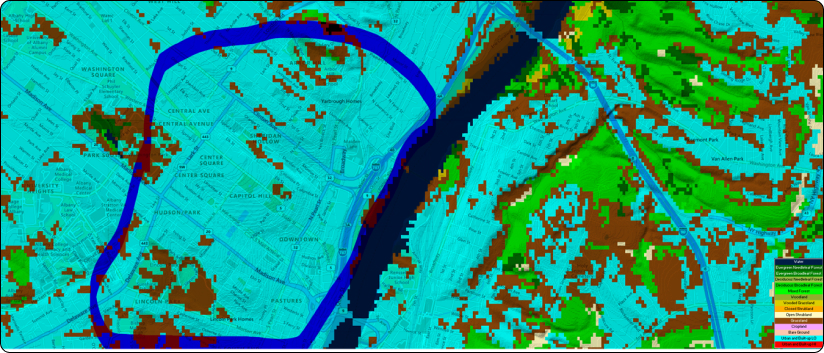
Even though this is a flat map view, this data has a height value as well.
- The resolution of clutter is based on the size of the pixel or “bin” of the data used for the overlay on terrain.
- The most commonly used data is typically 30 meters, meaning the pixel/bin for that clutter is a square measured 30 meter on a side which can be overlaid on a map.
- That bin gets classified with the category that takes up the majority of space within the bin even there is more that one category within (buildings, trees, cropland, etc.). An example might be a house within a grove of thick trees that would only get classified as trees even though there is a building there.
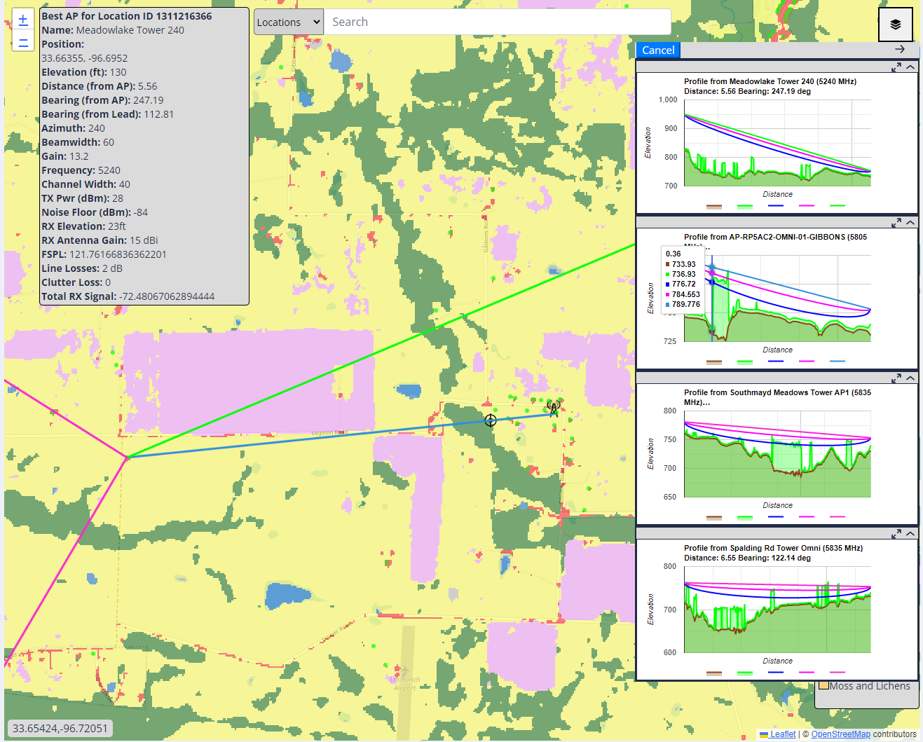
A cross section or path profile shows the terrain and clutter together.
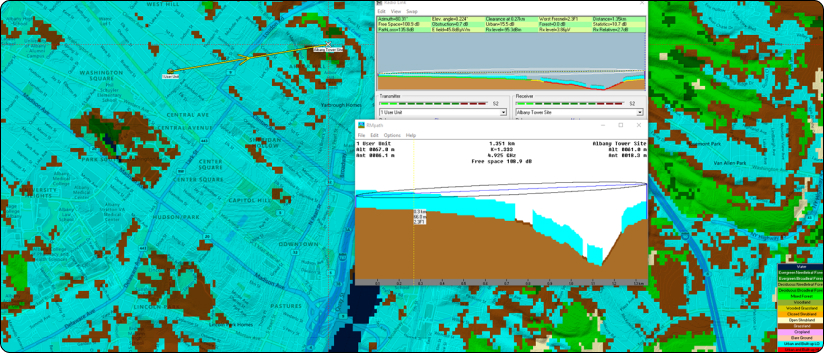
What is shown by 30 meter clutter data does not tell the full picture.
- 30m is a fairly large area and can contain more than one category that may be important, but not shown as it is not the dominant category in that bin (remember the house in the trees).
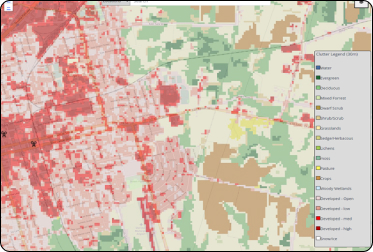
- If you increase the clutter resolution to 10 meters square, you can show more categories over the same area (9x more in fact).
- That house may now show up or in the opposite case where you have a single stand of trees in the front yard of an otherwise clear lot may now show up.
Another side by side Comparison
30m Clutter in Sherman, TX
10m Clutter in Sherman, TX
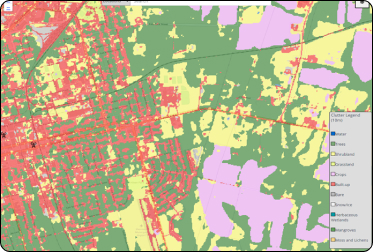
Profiles show this data better and losses for trees and such can be properly calculated to predict if a location is serviceable or not.